KEY PERFORMANCE INDICATORS

Maintaining momentum across metrices

We are positive about our ability to grow the Company profitably. We generated a significant amount of cash, strengthened our balance sheet and continued to return strong value to our shareholders.

Profit and loss metrics

Revenue from operations (` in Mn)

+38.8%
y-o-y growth

+4.9%
5-year CAGR

Operating profit (` in Mn)

+26.5%
y-o-y growth

+1.2%
5-year CAGR

Profit after tax (` in Mn)

+42.1%
y-o-y growth

-1.1%
5-year CAGR

Earnings per share (EPS) (`)

+42.1%
y-o-y growth

-1.1%
5-year CAGR

Balance sheet metrics

Total assets (US$ in Mn)

Net worth (US$ in Mn)

Book value per share (`)

Net debt (US$ in Mn)

Net debt to net worth (in multiples)

Net debt to operating profit (in multiples)

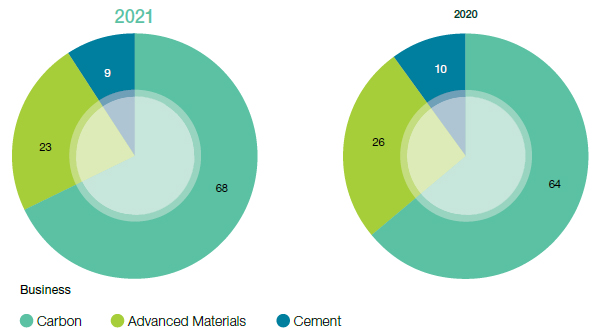
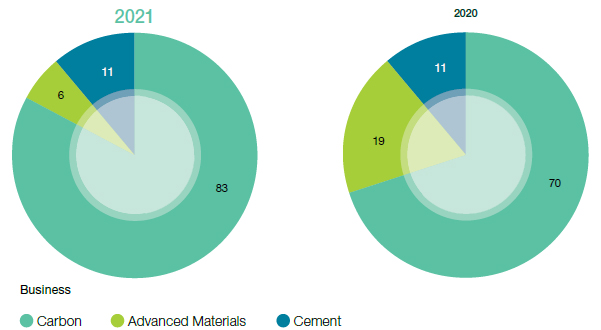
Business segment-wise metrics

Revenue (%)


Operating profit (%)


Revenue by end industry (%)


Profit reported during the year (` in Mn)


Particulars Operating profit Profit after tax
Reported amount 25,291 5,801
Adjustments    
− Expenses towards strategic projects and other non-recurring items 540 540
− Repair and other costs incurred on account of hurricane 513 513
− Insurance claims received during the year related to prior years (337) (337)
− Gain on disposal of assets held for sale (221) (221)
− Reversal of reorganisation costs accruals (103) (103)
− Income due to waiver of Payroll Protection Program Loan by federal government of United States (469) (469)
− Gain on divestment of superplasticizer business (40) (40)
− Impairment of pond pitch asset   168
− Tax impact on above adjustments   (174)
− Valuation allowance of deferred taxes   1882
Adjusted amount 25,174 7,560

Note: Operating profit = Profit before depreciation and amortisation, impairment loss, interest and taxes adjusted with exceptional items, if any.